Redshift is the effect of light form an object being shifted towards the red end of the visible spectrum. This effect occurs when an object is moving away from the observer. Due to the Doppler effect, the wavelength of the light is increased and the object appears redder.
Due to the expansion of the universe, cosmological objects that are sufficiently far from Earth are redshifted. The amount of redshift is related to the object’s distance from Earth. Due to this relationship, cosmological redshift is a valuable tool for learning about the large-scale structure of the universe.
Spectroscopy Versus Photometry
Spectroscopy and photometry are two methods for determining the redshift of an object. Spectroscopy provides more accurate values, but is more costly and time consuming than photometry. Because of this, many attempts have been made to accurately estimate redshift using photometric data.
Redshift Estimation
Attempts to estimate photometric redshift can be broadly divided into two groups. One group uses an empirical approach which use only the magnitudes of photometric filter data. The second group tries to fit spectral energy distribution (SED) templates to the photometric data.
The problem is essentially a classification problem and many common classification techniques have been applied. However, all techniques that I have encountered have used continuous (rather than discrete) classification techniques which directly output a redshift value.
Photometric Redshift Estimation
This project attempts to estimate photometric redshift using a multistage approach. The first stage uses a supervised, multiclass classifier to broadly group objects into one of a number of classes. For example, we may want to divide objects into those with high, medium, or low redshift. Once the data is divided, each subset of the data is used to train a classifier which uses the common single stage, continuous approach.
Results
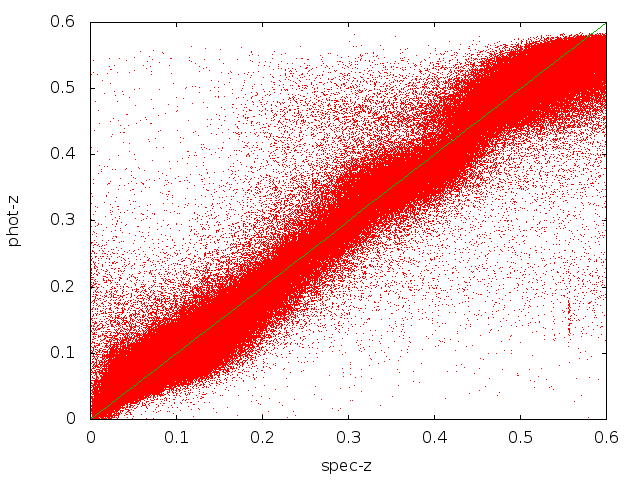
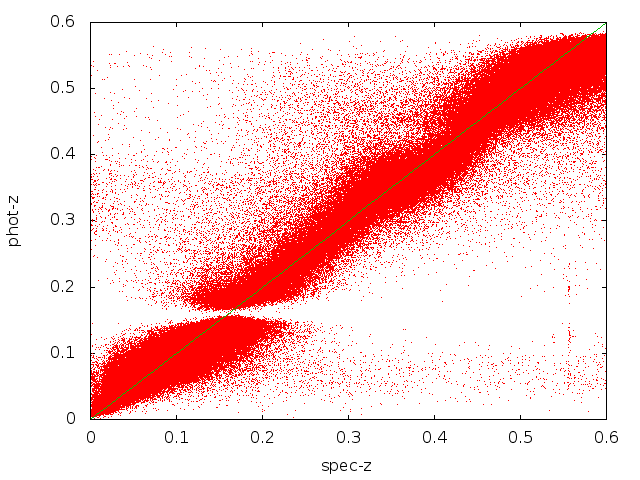
My multistage approach seems to perform comparably to one existing method. The two images provide a comparison of ANNz [website/download] (first image), and my multistage approach (second image), which uses ANNz for the second stage. The results are not obvious from looking at the images because they contain so many points (500,000 galaxies with redshift between 0 and approximately 0.6). However, the average error is much more telling. After removing outliers, both the standard ANNz and my multistage approach have approximately the same average error (13.37%).
A much more detailed description of this project and the results can be found here.